Enterprise-grade FP&A. Without the enterprise project.
AIchieve turns the spreadsheets you already built into a live FP&A platform, connected to your ERP, CRM, and HR systems with AI. Live in days, not quarters.
PLANNING | REPORTING | ANALYSIS | CLOSE | CONSOLIDATION
Meet the Agents
Three agents, every stage of the planning cycle, all working from the same data — Modeler, Analyst, and Planner.
Turn your spreadsheet into a system
Point the Modeler at the workbook your team already trusts. It learns your hierarchies, formulas, account mappings and consolidation logic, including intercompany eliminations, FX and multi entity structures, then rebuilds them as a live model connected to your ERP, CRM and HR systems.
- Modeling
- Approvals
- Consolidation
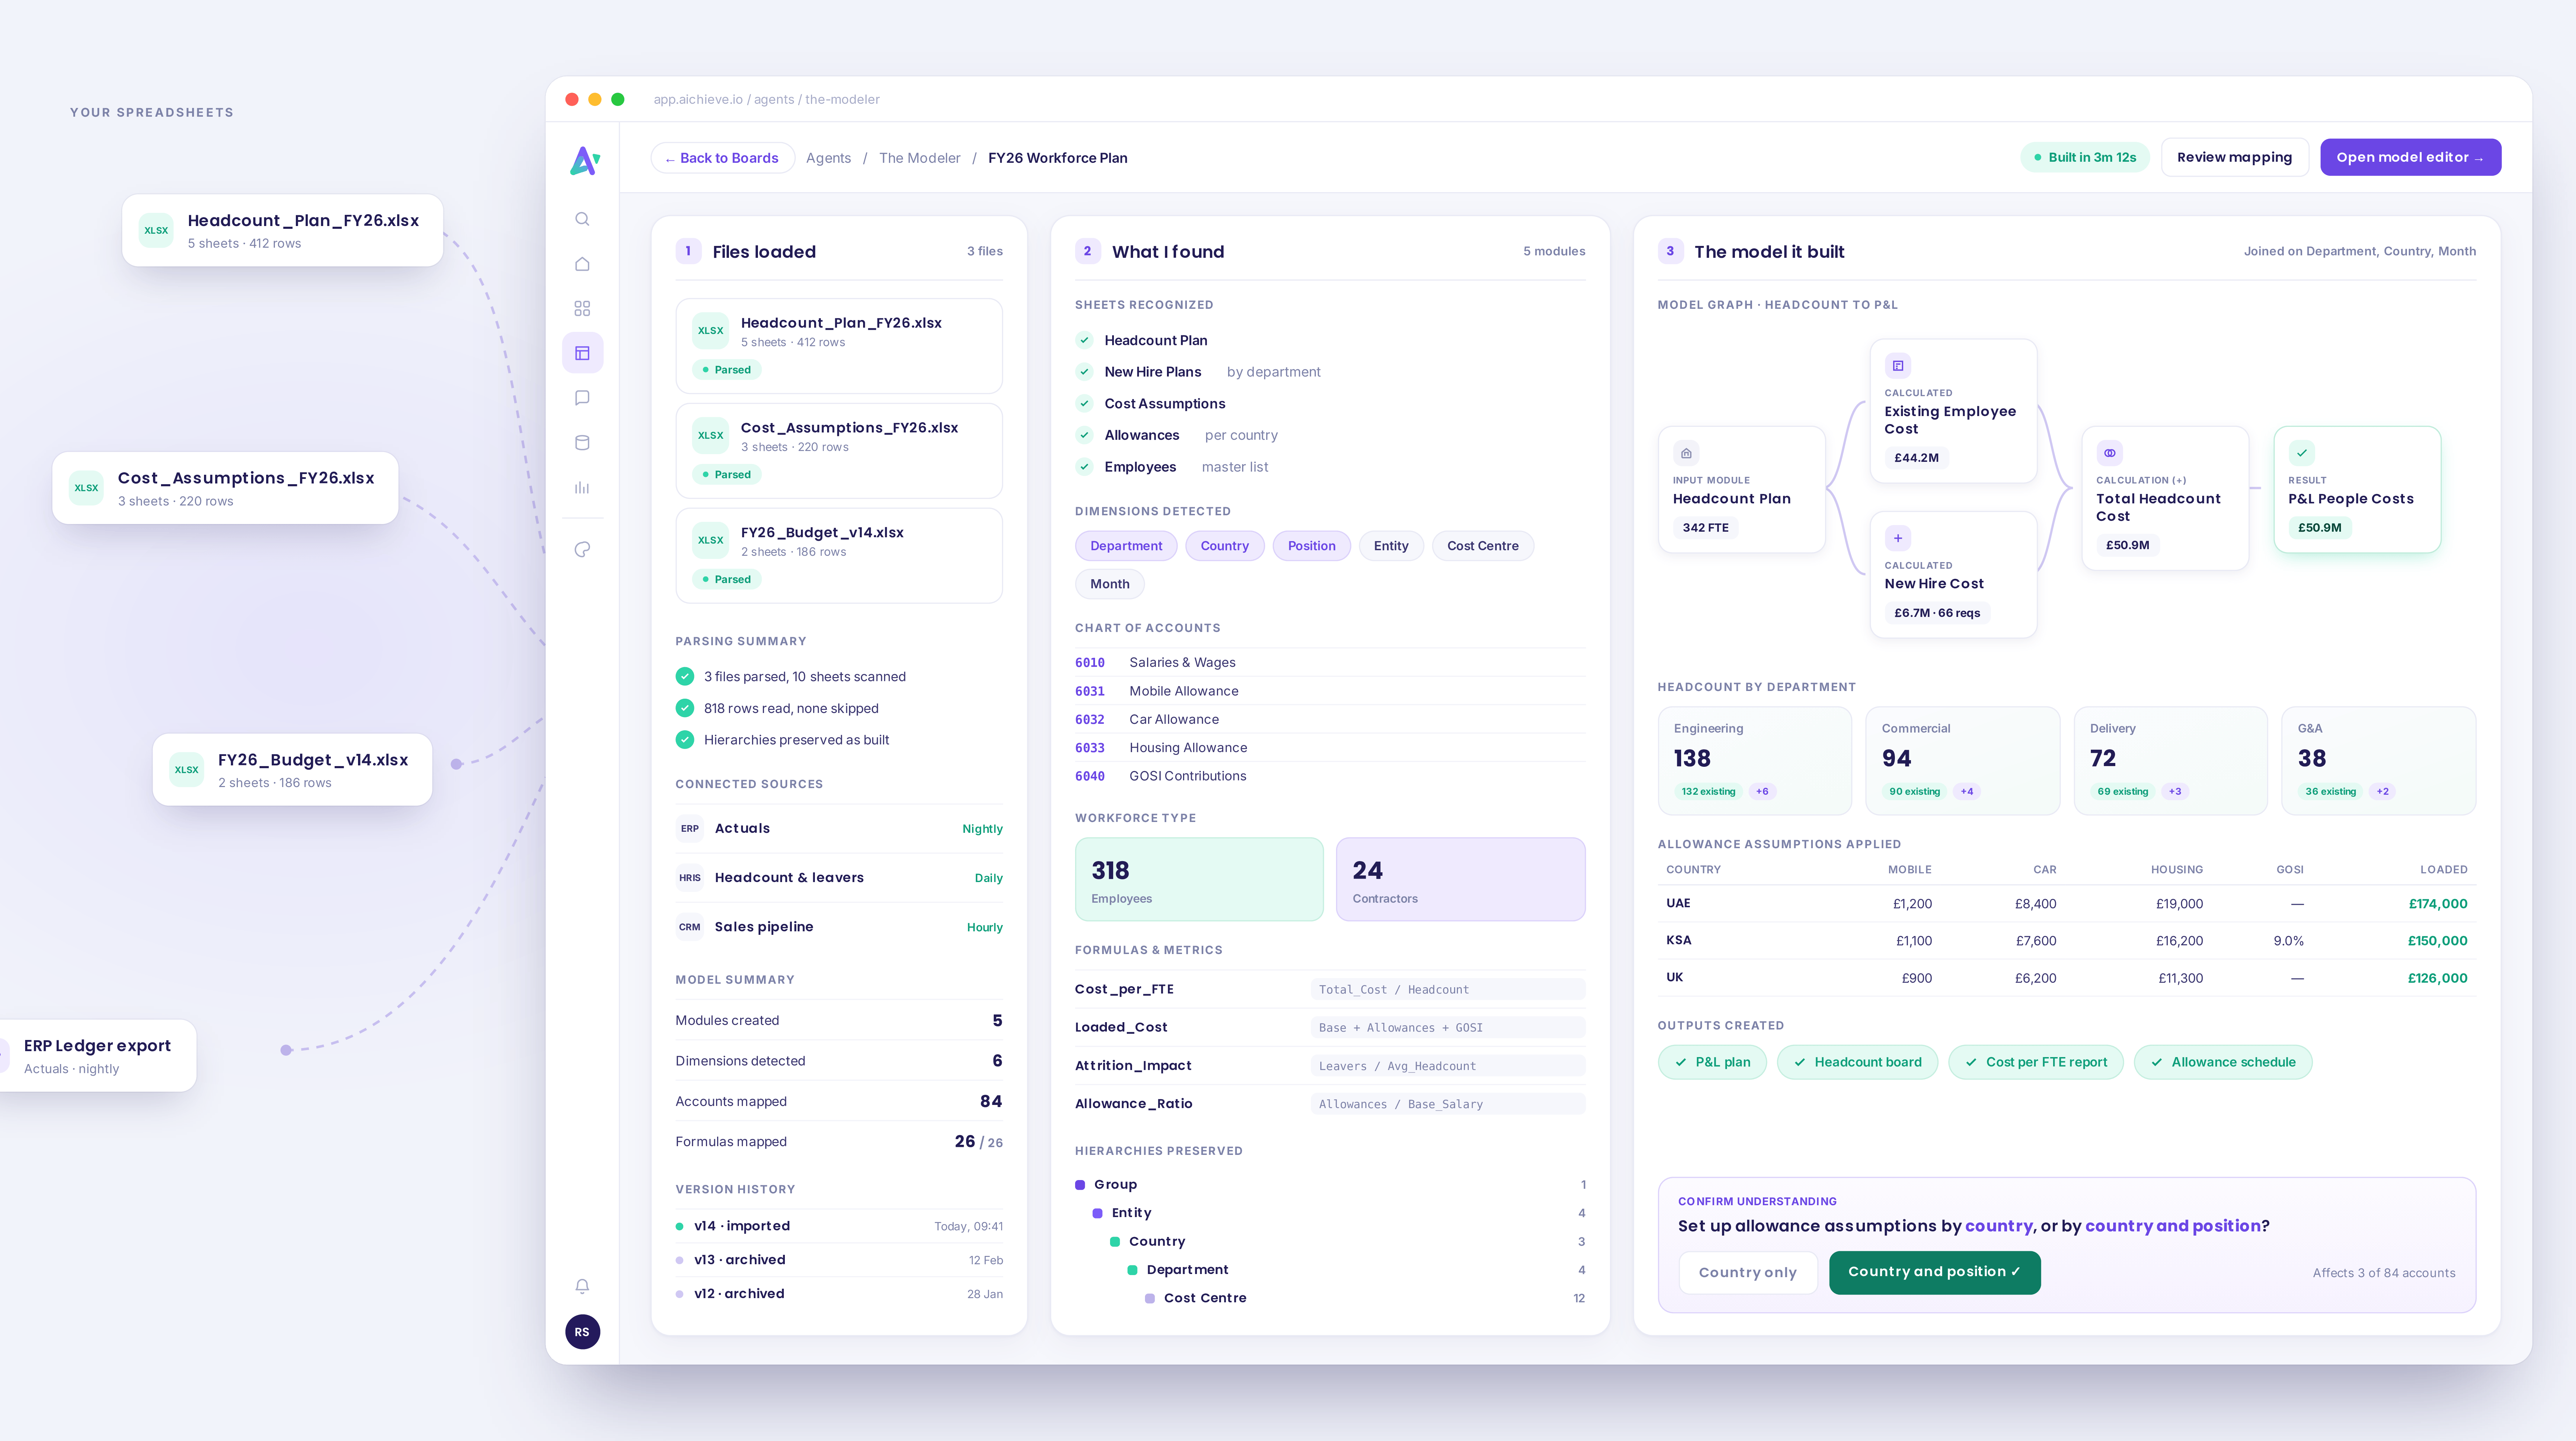
FY26_Budget_v14.xlsx
· 6 sheetsModules detected in your workbook, connected on shared keys
Sales Plan
Region
Product
# Revenue
Workforce Plan
Rep_Name
Region
# Headcount
Budget
Region
Month
# Budget_Amount
Actuals
Region
Month
# Actual_Amount
Joined on Region and Month across all four modules
Computed metrics
System notification
Your FY26 budget model is now live in AIchieve. 412 formulas and all four entity hierarchies moved across exactly as you built them. Six account mappings need your confirmation before I connect ERP.
FY26 Budget Dashboard
Built automatically from your workbook
$28.4M
Total Budget
+2.1% vs plan
412/418
Accounts Mapped
6 pending
2 of 5
Depts Over Budget
Sales, Operations
Budget vs Actual by Department
Allocation
Turn business signals into decisions
The Analyst watches how the business is running across sales, operations, supply and finance. It catches anomalies while they are still small, finds where departments have drifted out of alignment, benchmarks your performance against your market, and comes to you with the recommendation, explained.
- Alerts
- Findings
- Recommendations
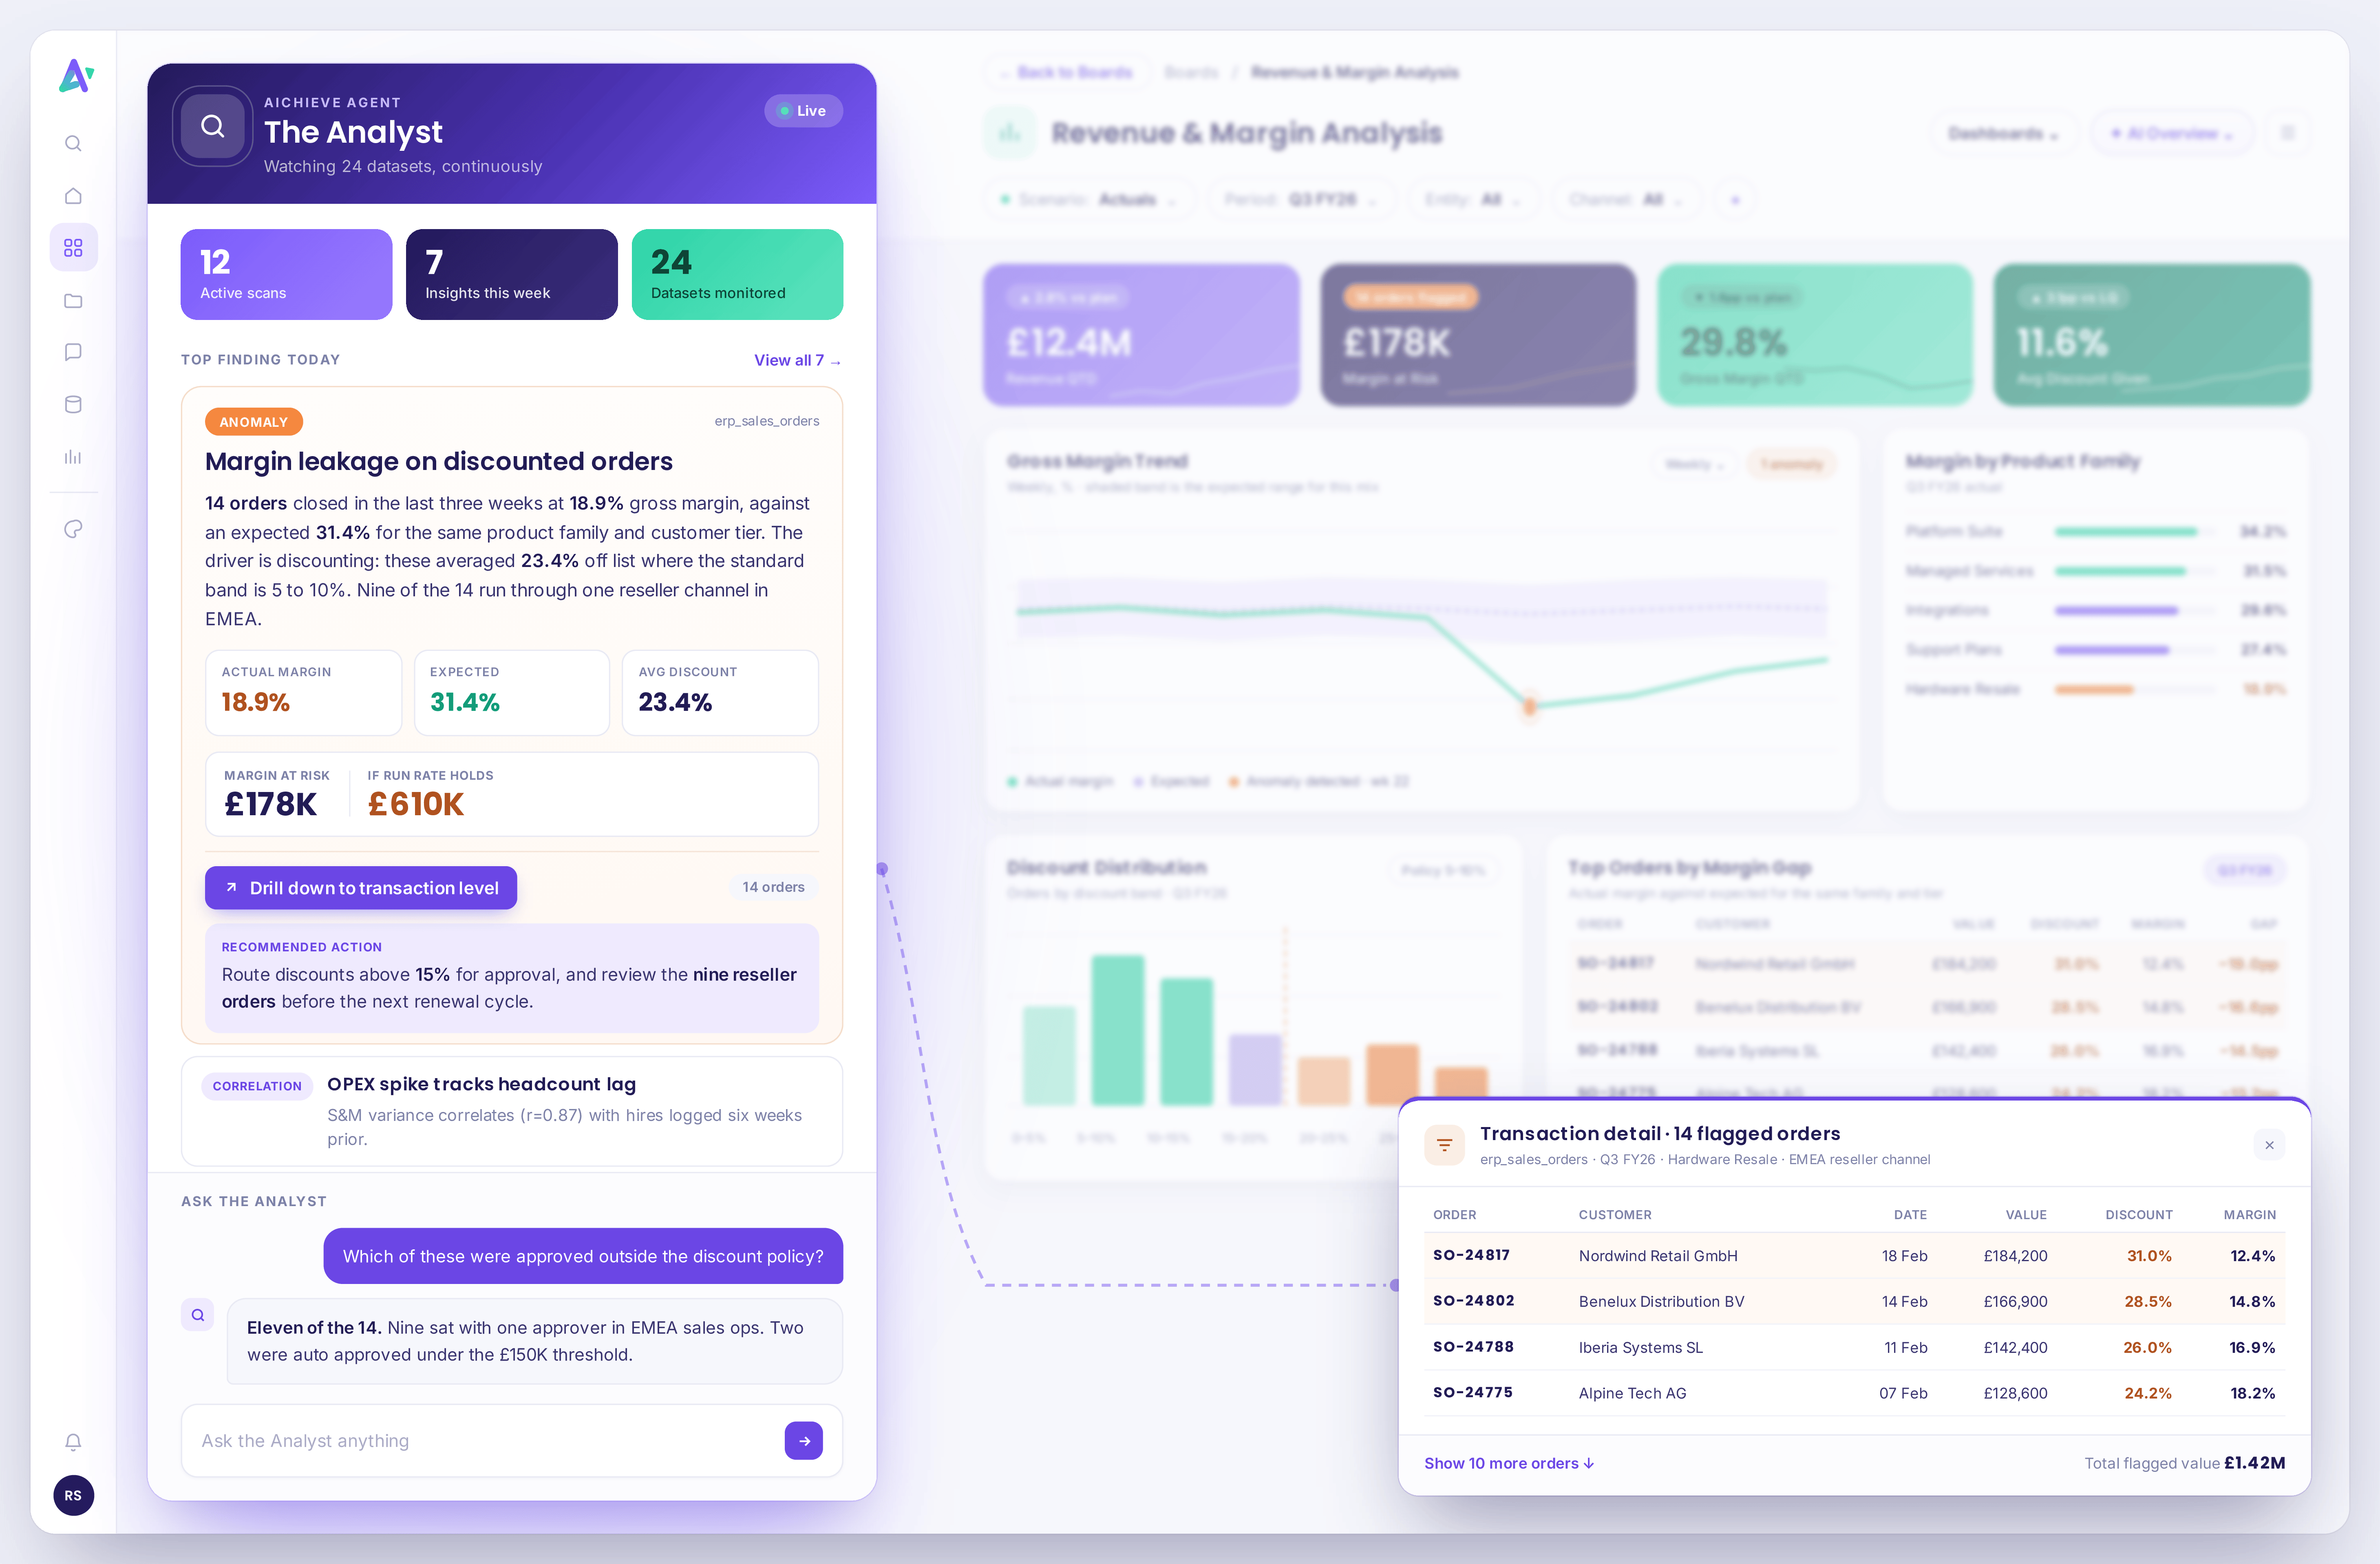
Autonomous Data Analyst
Scheduled scans on your datasets · anomalies, trends, correlations
12
Active scans
7
Insights this week
24
Datasets monitored
Latest insights · Scheduled scans
Margin on enterprise renewals dropped 2.4pp vs trailing 8-week average. Concentrated in Q3 credits.
Review promotional credits on EMEA GmbH and UK Ltd
Sales & Marketing OPEX variance correlates (r=0.87) with hires logged 6 weeks prior in HRIS.
Align hiring plan with S&M budget drivers
Three-week moving average up 4.1% MoM. Driven by enterprise segment, not SMB.
Update forecast scenario before month-end close
System notification
Freight cost per unit is up 18% in Benelux and still climbing. At this rate it costs you £340k by year end. Your sector median is 6%.
Analysis Dashboard
Automated scans across your connected datasets
7
Anomalies Detected
24
Datasets Monitored
2.4 hrs
Avg Detection Time
98%
Coverage
OPEX Variance vs Headcount Δ · r = 0.87
Findings by Type
Revenue · Actual vs Expected
Turn a decision into a plan
Change a driver, whether headcount, pricing, FX or a delayed launch, and the Planner propagates it through revenue, cost, workforce, CAPEX and cash on the same connected model, then tells you what the decision costs and what it buys.
- Scenarios
- Forecasts
- Cash impact
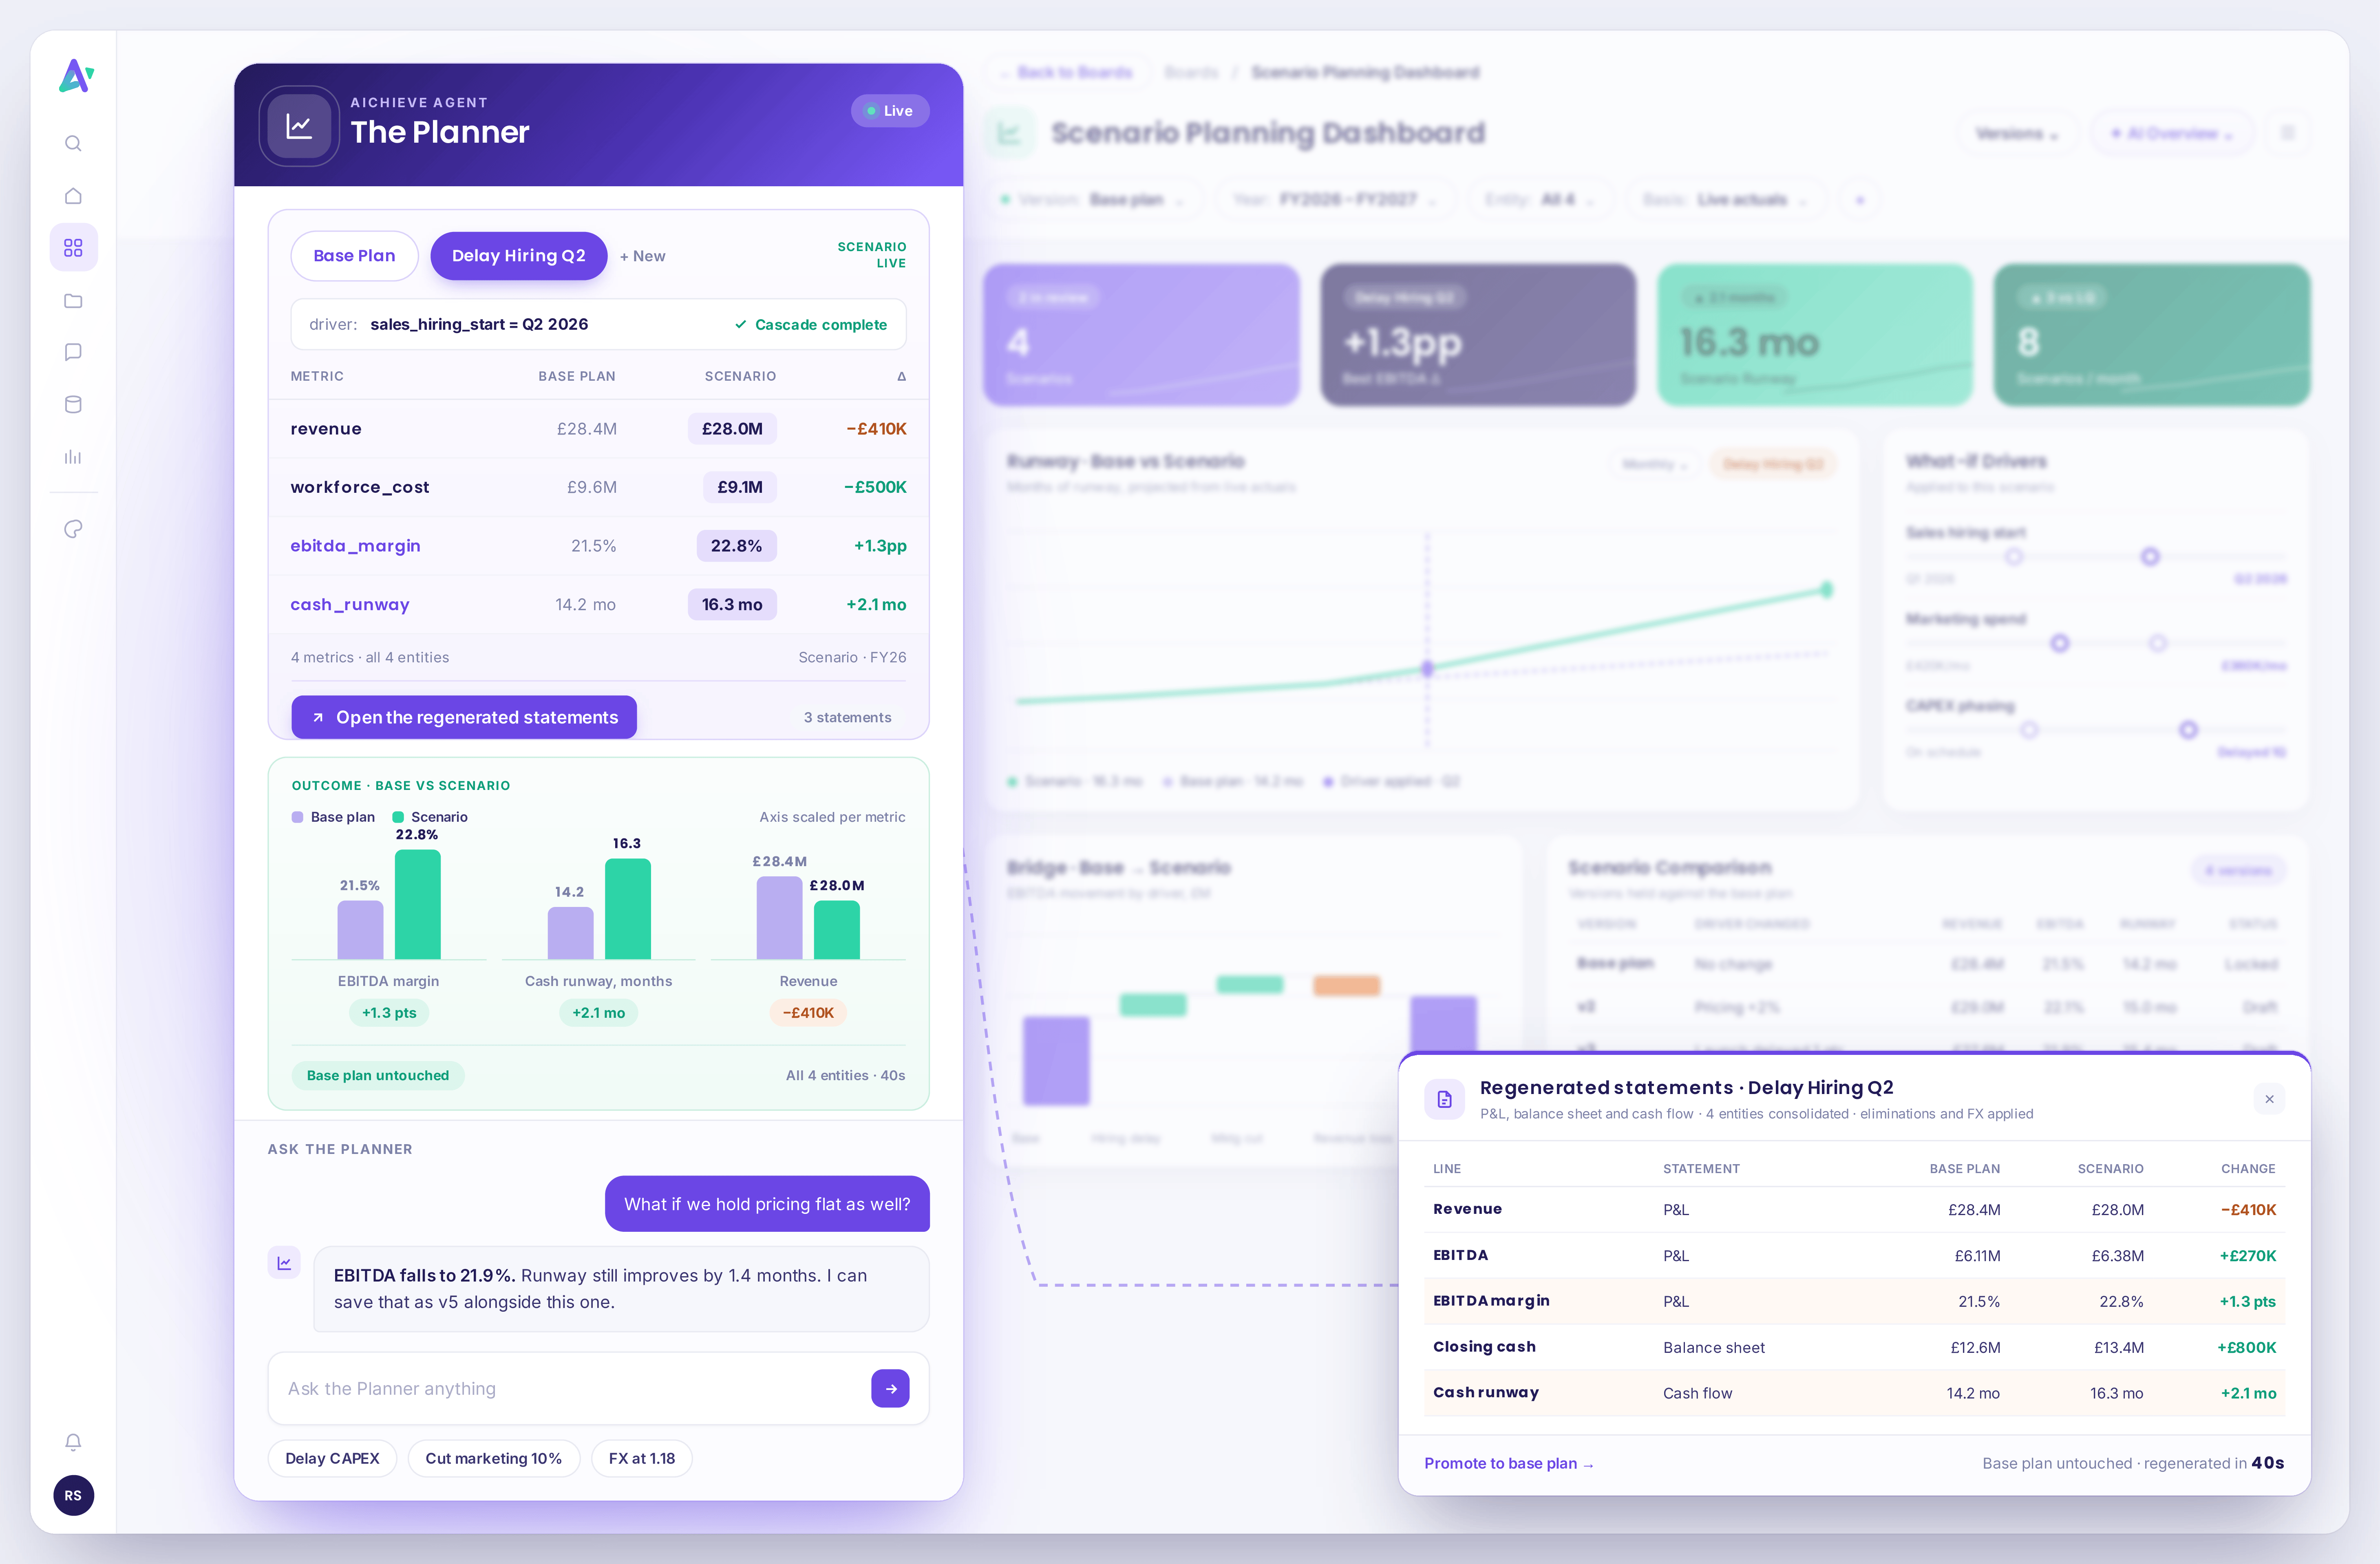
FY26 Scenario Model
Compare a driver change against your base plan
driver: sales_hiring_start = Q2 2026 (was Q1 2026)
Cascade completeSystem notification
An additional version of the plan has been built on delaying sales hiring by one quarter. P&L, balance sheet and cash flow regenerated across all four entities: EBITDA up 1.3 points, runway up 2.1 months, revenue down £410k. Your base plan is untouched.
Planning Dashboard
Model what-if scenarios against your base plan
3
Active Scenarios
+1.3pp
Best EBITDA Δ
16.3 mo
Cash Runway
8
Scenarios / mo
Cash Runway · Base vs Scenario
What-if Drivers
Sales hiring start
Marketing spend
CAPEX
EBITDA Bridge · Base → Scenario
Built for the FP&A work you run all year
It's beyond finance, one model for all operations.
Make finance a driver of growth rather than a reporting function. Automated reporting, forecasting and scenario planning, with the drivers behind every number surfaced so the team turns data into foresight and makes decisions with confidence. Financial close and consolidation included.
Trusted by





AIchieve
one reconciled model
Connections
Your ERP, CRM, and warehouse. Live in one fabric.
Your systems
SAP
0 rows
Salesforce
0 rows
NetSuite
0 rows
Snowflake
0 rows
Files & formats
Excel
Spreadsheet → database
CSV
Columnar file upload
Parquet
Warehouse-ready ingest
Every system you run, reconciled into one model
Connect your financial and operational systems through prebuilt integrations, and let the agents cleanse, map and reconcile what arrives. Your model evolves with the business, with every number traceable back to the system it came from.
- Real time
- or on demand refresh
- Multiple systems
- reconciled into one model
- Row level
- traceability to source
Bring your last forecast. Watch it become a live model.
Your own workbook, your own numbers, and see your actuals, variances and forecast running in one place. If it does not tie to the month you already closed, you will know inside the call.
✓ No preparation needed
✓ Your data, not a sample dataset


